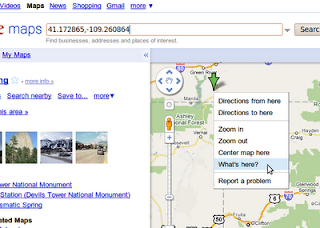
First you will need to know the bounds of t
 he area you are targeting. For this example we will use temperature data from RWIS roadside sensors but we are only interested in Colorado. At the time of this writing you can right click on Google Maps and click "What's here?" and it will display the latitude and longitude in the search box.
upper_left = (41.172865, -109.260864)
lower_right = (36.926183,-101.867066)
We will need to setup the projections, this EPSG (900913, google) is known to work with Google Maps (and others):
def get_mercator_projection():
  proj = osr.SpatialReference()
  proj.ImportFromEPSG(900913)
  return proj
We will also need a projection for our input decimal latitude longitude values:
def get_default_projection():
  proj = osr.SpatialReference()
  proj.ImportFromEPSG(4326)
  return proj
We will also need a geotransform array that defines the origin and pixel size of the projection we want to use. This can be created with the boundaries we chose above and the width and height of the image we want to create, there should be a relationship between negative pixel sizes and the hemisphere you are mapping because the mercator origin is not at the top left of the earth, this code attempts to correct this but it might only work for north america:
    def get_geo_transform(upper_left, lower_right, width, height, transform):
      (ul_px, ul_py, z) = transform.TransformPoint(upper_left[1],upper_left[0])
      (lr_px, lr_py, z) = transform.TransformPoint(lower_right[1],lower_right[0])
      dx = abs(ul_px - lr_px)
      dy = abs(ul_py - lr_py)
      pixel_size_x = dx / float(width)
      pixel_size_y = dy / float(height)
      if ul_px < 0 and pixel_size_x < 0: # does this make sense?
          pixel_size_x *= -1             #this might only work for North America...
      if ul_py > 0 and pixel_size_y > 0:
          pixel_size_y *= -1
      return [ul_px,
              pixel_size_x,
              0,
              ul_py, #these values are in a weird order but this is correct
              0,
              pixel_size_y]
This geotransform will define the pixel to lat/lon transformation but we need an inverse of this to map our lat/lon values to a pixel on our image (this feature requires gdal-1.7.1 or greater):
merc_proj = get_mercator_projection()
def_proj = get_default_projection()
def_transform = osr.CoordinateTransformation(def_proj, merc_proj)
geo = get_geo_transform(upper_left, lower_right, width, height, def_transform)
inv_geo = gdal.InvGeoTransform(geo)[1]
Now we are ready to transform a lat/lon to pixel:
def get_pixel(lat, lon, inv_geo, transform):
  (gx,gy,gz) = transform.TransformPoint(lon,lat)
  (gx, gy) = gdal.ApplyGeoTransform(inv_geo, gx, gy)
  px = int(gx)
  py = int(gy)
  return (px,py)
Now we can bring it all together and read our temperature data to create an image using python PIL:
#!/usr/bin/env python

from osgeo import osr
from osgeo import gdal
from PIL import Image
from PIL import ImageDraw
from PIL import ImageFont

fontfile = "/usr/share/fonts/truetype/freefont/FreeSans.ttf"
fontsize = 10
input_data_file = "rwis_temp_20090107.0000.csv"
output_image = "rwis_temp_20090107.0000.png"
upper_left = (41.172865, -109.260864)
lower_right = (36.926183,-101.867066)
width = 1200
height = 1200

class georef:

  @staticmethod
  def main():
      gref = georef(upper_left, lower_right, width, height)
      f = open(input_data_file,"r")
      for l in f.readlines():
          ls = l.split(",")
          lat = float(ls[1])
          lon = float(ls[2])
          temp = int(ls[3])
          tempf = temp * (9.0/5.0) - 459.67
          if tempf < -20 or tempf > 100:
              continue
          gref.draw_text(lat,lon,tempf)
      gref.write_image(output_image)

  def __init__(self, upper_left, lower_right, width, height):
      merc_proj = georef.get_mercator_projection()
      def_proj = georef.get_default_projection()
      self.def_transform = osr.CoordinateTransformation(def_proj, merc_proj)
      geo = georef.get_geo_transform(upper_left, lower_right, width, height, self.def_transform)
      self.inv_geo = gdal.InvGeoTransform(geo)[1]
      self.img = Image.new("RGBA",(width,height),(0,0,0,0))
      self.width = width
      self.height = height

  def draw_text(self, lat, lon, value, color = (0,0,0,255)):
      (px,py) = georef.get_pixel(lat,lon,self.inv_geo,self.def_transform)
      if px > self.width or px < 0 or py > self.height or py < 0: # throw out anything outside our domain
          return
      if (0,0,0,0) != self.img.getpixel((px,py)): #skip stuff that is here already
          return
      dr = ImageDraw.Draw(self.img)
      font = ImageFont.truetype(fontfile,fontsize)
      dr.text((px,py), "%d" % value, font=font, fill=color)
      del dr

  def write_image(self, fname):
      self.img.save(fname)

  @staticmethod
  def get_mercator_projection():
      proj = osr.SpatialReference()
      proj.ImportFromEPSG(900913)
      return proj

  @staticmethod
  def get_default_projection():
      proj = osr.SpatialReference()
      proj.ImportFromEPSG(4326)
      return proj

  @staticmethod
  def get_geo_transform(upper_left, lower_right, width, height, transform):
      (ul_px, ul_py, z) = transform.TransformPoint(upper_left[1],upper_left[0])
      (lr_px, lr_py, z) = transform.TransformPoint(lower_right[1],lower_right[0])
      dx = abs(ul_px - lr_px)
      dy = abs(ul_py - lr_py)
      pixel_size_x = dx / float(width)
      pixel_size_y = dy / float(height)
      if ul_px < 0 and pixel_size_x < 0: # does this make sense?
          pixel_size_x *= -1             #this might only work for North America...
      if ul_py > 0 and pixel_size_y > 0:
          pixel_size_y *= -1
      return [ul_px,
              pixel_size_x,
              0,
              ul_py, #these values are in a weird order but this is correct
              0,
              pixel_size_y]

  @staticmethod
  def get_pixel(lat, lon, inv_geo, transform):
      (gx,gy,gz) = transform.TransformPoint(lon,lat)
      (gx, gy) = gdal.ApplyGeoTransform(inv_geo, gx, gy)
      px = int(gx)
      py = int(gy)
      return (px,py)


if "__main__" == __name__:
  georef.main()
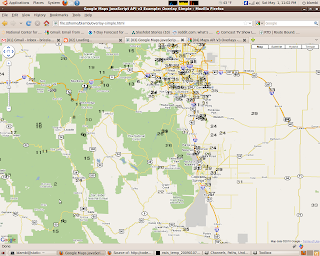
download the test data here: rwis_temp_20090107.0000.csv. This should result in an image that looks like this:

Now we can overlay this on a map using Google Maps API v3, see this example for how to overlay images. Notice that a bounding box in Google Maps is definded by lower left and upper right corners. Also, as you zoom in the resolution is not so nice. One could expand on this to support different zoom levels or even serve these images in real-time based on the bounds provided by the Google Maps API.

No comments:
Post a Comment